
May 20, 2016
When you've taken the time to set-up and run a Net Promoter Score Poll you might be curious what the results say about your company and product. Though you have to take into account a few things when analyzing the results in order not to draw the wrong conclusions.
Of course you want to be better than the competition, therefore it's tempting to see if you can find their NPS scores and compare it to yours. Though unless you are using it as a generic insight, don't compare yourself to other companies. Why, you ask? For starters, because you don't know what method they used to get their scores. Did they have a long survey with multiple questions or only the NPS question? It also differs a lot if the question is asked on a specific page in the flow, at the point people tend to leave your website, at all possible pages or only after having used the full product or service. Next to that different target groups can lead to different results, you can imagine that asking new visitors that haven't used your product fully score differently than recurring users that already experienced the full process you have to offer. If you don't know all these factors from your competitors test, it's better not to compare it to your score at all.
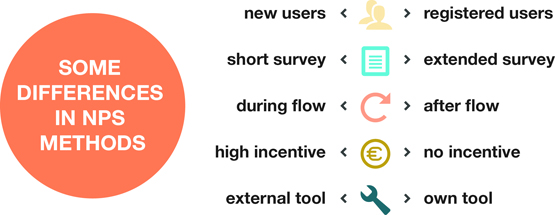
When you are starting to gather NPS input you can experiment a bit with what method provides you with good usable feedback. For example a Hotjar Poll to all users or a mail survey to your registered users. Assuming you are collecting NPS scores because you want to know where to improve, not only to show off a number, you want to chose the method that provides you with the best insight why people score the way they do. That way you are able to create concrete action points to improve your product and the user's satisfaction. Once you've chosen a method you have to stick to this method. Don't mix or compare the results of multiple methods, because the target groups and moment of questioning can influence the scoring. The target group of registered users are (probably) more loyal to you and know the product or service in more detail, while the group of new users can only score your product on what they've seen in the first moments of use. Even when you ask the same group all the time, you don't want to switch the moment you ask for an NPS rating. When scoring the NPS on the website people are asked when they are actually using the product, instead of when people are asked through email one has to recall their experience. If you've chosen to provide an incentive to get feedback from your user, keep in mind that this can also influence their scoring. Therefore you shouldn't change the incentive and not expect a possible change in the scoring. When you want the most reliable results possible you shouldn't change anything to your method, otherwise it's hard to detect if a difference in scoring is due to a change in your product or a change in your method.
While your product might not change during the year, or even when it does, your users can have different goals over the months. For example on a webshop, outside of the holiday season people might just look around for information without buying something. While during the holiday season people want to be able to make decisions easily and it will become more important for them to know if they will have their presents in time for the holidays. This 'stress' can definitely influence the way they score your website, being more forgiving in some cases and strict in others. This doesn't mean you cannot compare your scores from month to month, but when doing so try to figure out what can influence the scoring next to the service you provide.
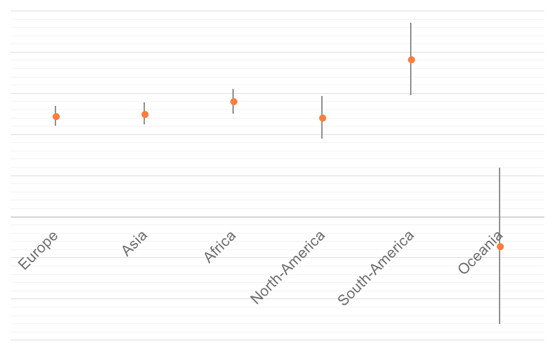
If you have a product that is used globally and you have NPS results from all over the world, don't be bothered too much when there are quite some differences. The way people score things differs highly based on where they are from. While in the USA most people are graded from A-F, India uses different scores all together and in some European countries from 1-10, the NPS system is always from 0-10. This makes the relationship to these numbers different for different regions in the world.
After performing a NPS Poll for StudyPortals this continental difference was very clearly showing in a higher score for users from South-America and a drastically lower score for Oceania.
When analyzing your NPS data, checking the data of different browsers or pages you can see where improvements are necessary. Though it is not per se clear what needs to be improved. Therefore you need to use other data, such as screen recordings, heatmaps or Google Analytics. With that you can get a better view on how people (like) to use the pages and check for recurring bugs, usability issues or why people need a lot of time on a specific page. Based on this you can create concrete action points to improve your NPS in the future. These concrete improvements are also ideal to check during next NPS measurement, because you can check if you've solved the issues or that it needs some extra attention.
So, what's next? It is important to regularly test your NPS, check for changes in the results and look further than the grade itself to draw proper conclusions on what you need to improve to satisfy your users.